Data
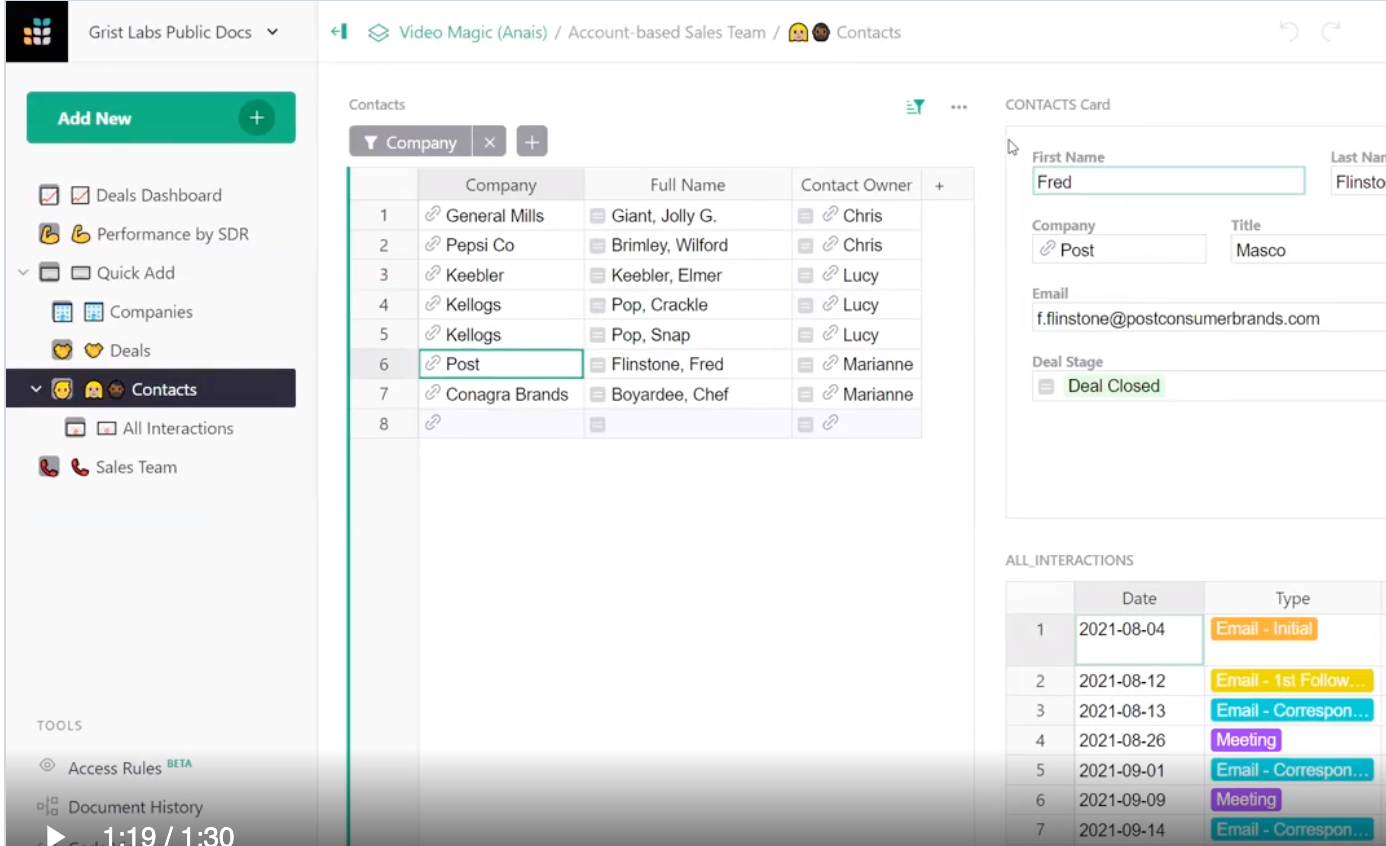
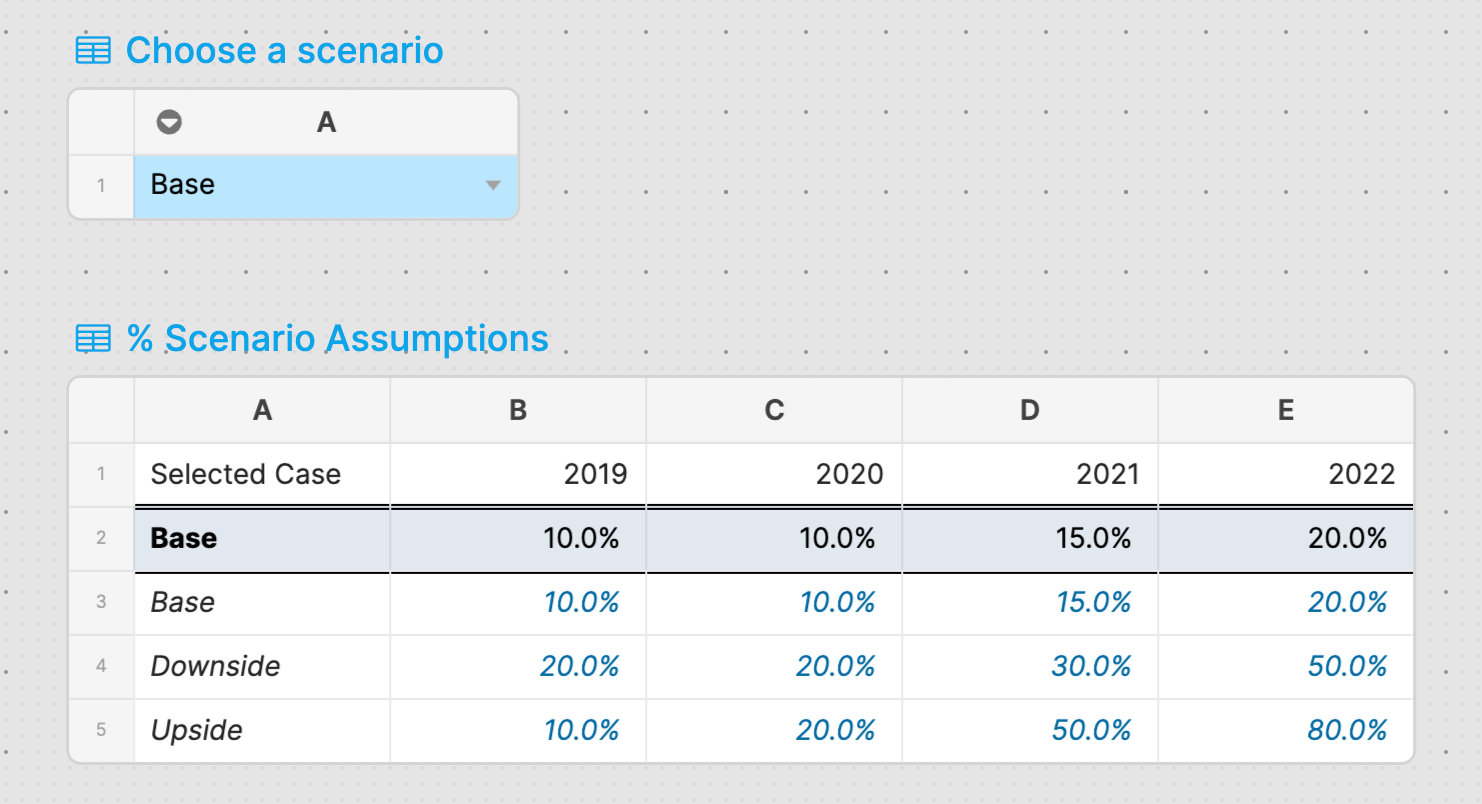
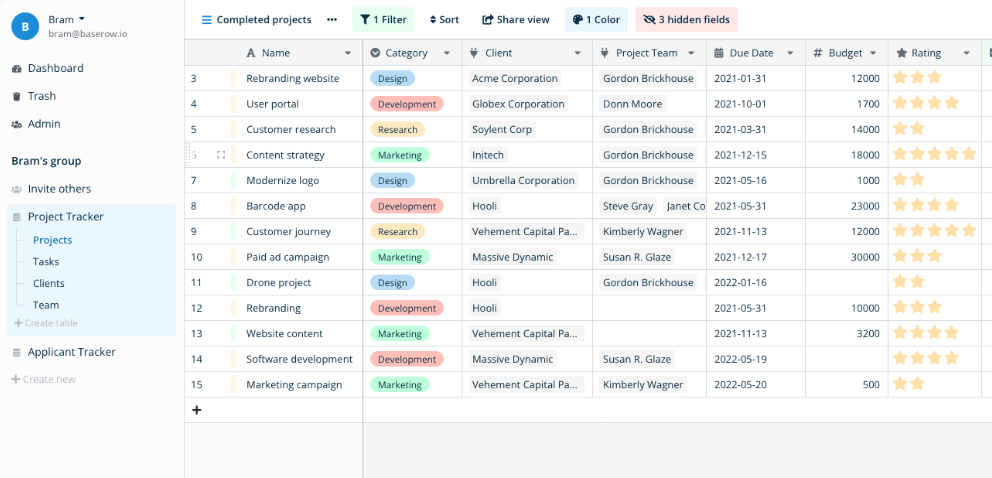
Grist
Grist is a spreadsheet-relational-database hybrid (like Baserow and NoCoDB). I like these no-code/low-code products because for most people (i.e not enterprises) a relational DB makes a lot of sense, but in terms of tools and UX they are awful, so people use spreadsheets and lose "relationalability".
Infogram
Quickly adapt infograph templates to fit your data. Used to freemium and nice. Now you can't download. RUBBISH!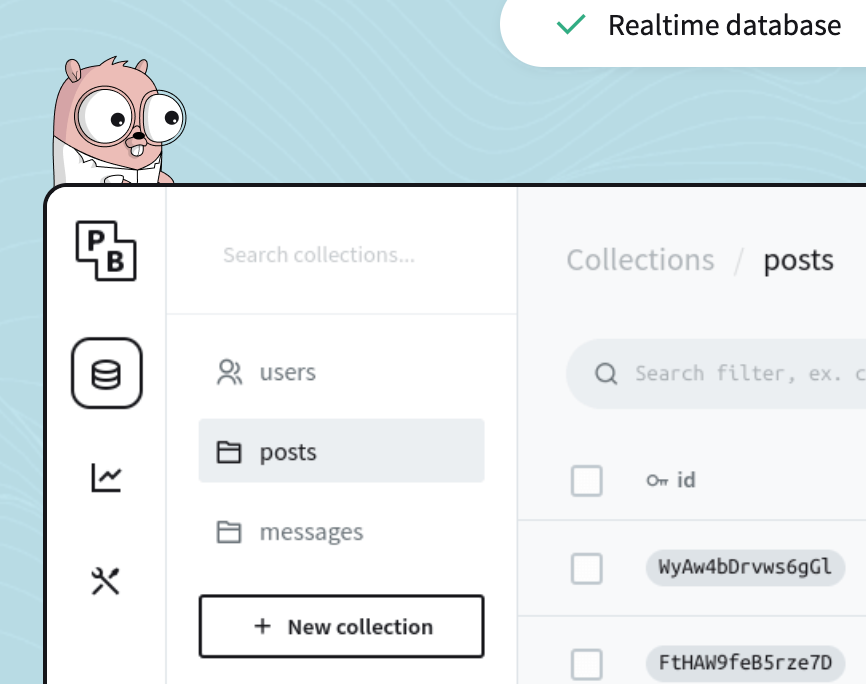
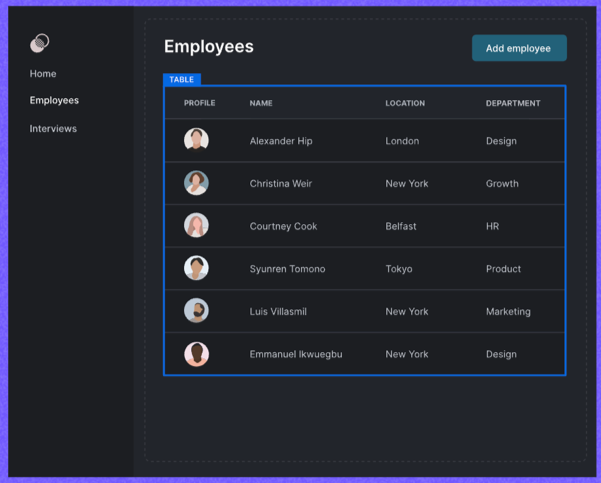
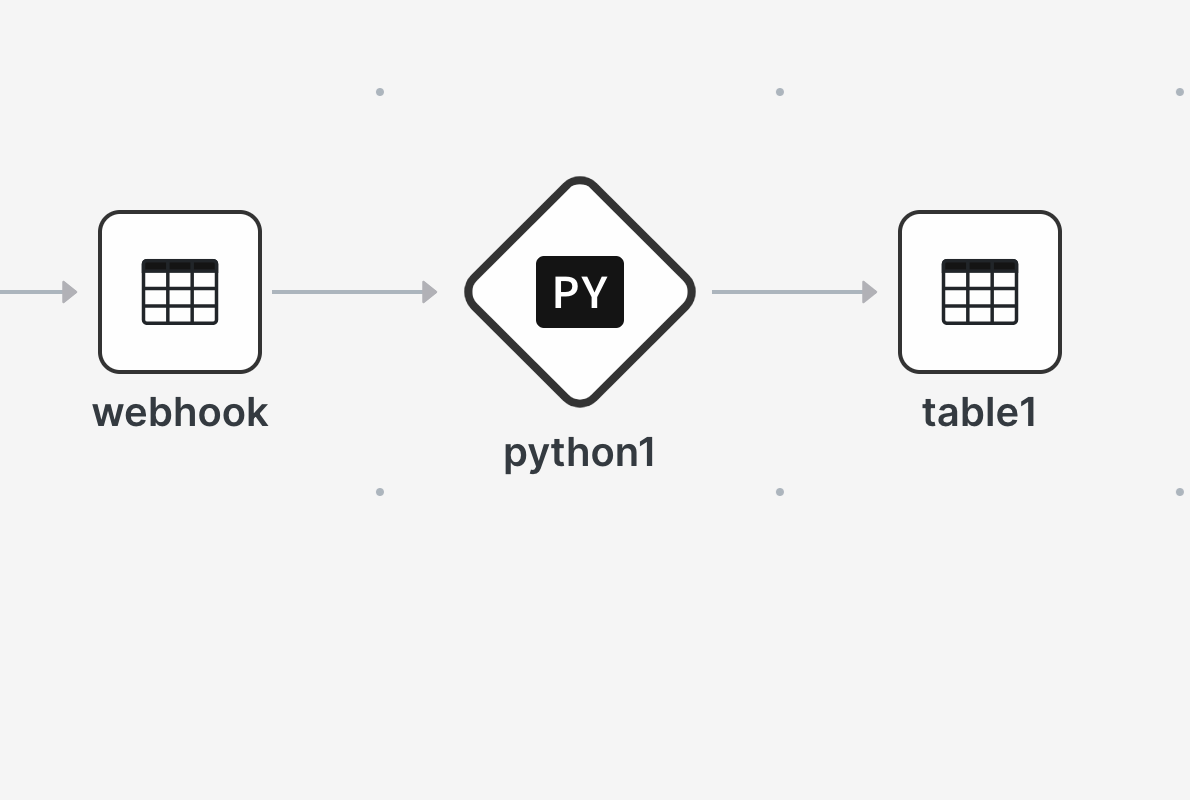
PocketBase
Small database for Javascript dev... looks like it might be powerful and useful to use on Glitch.com. It's SQLite under the hood but has things like authentication which appeals to me as a hobby dev.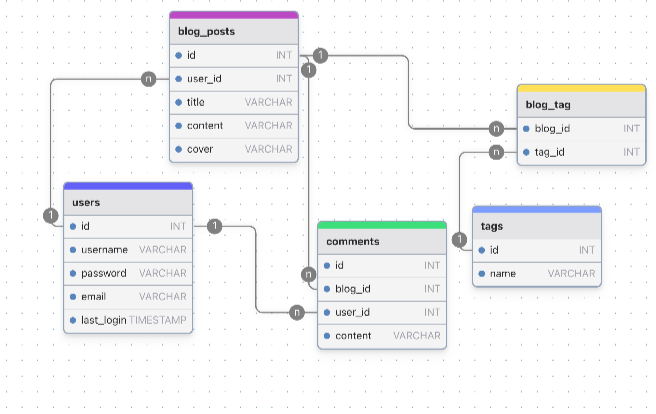

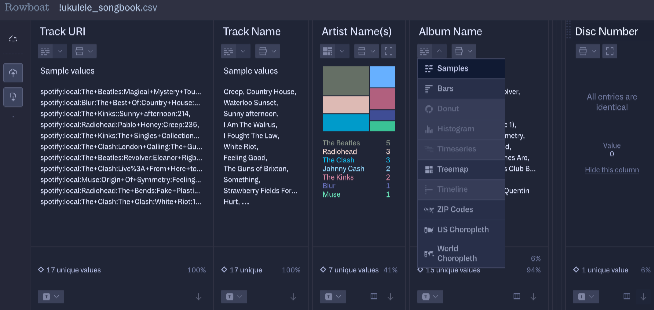
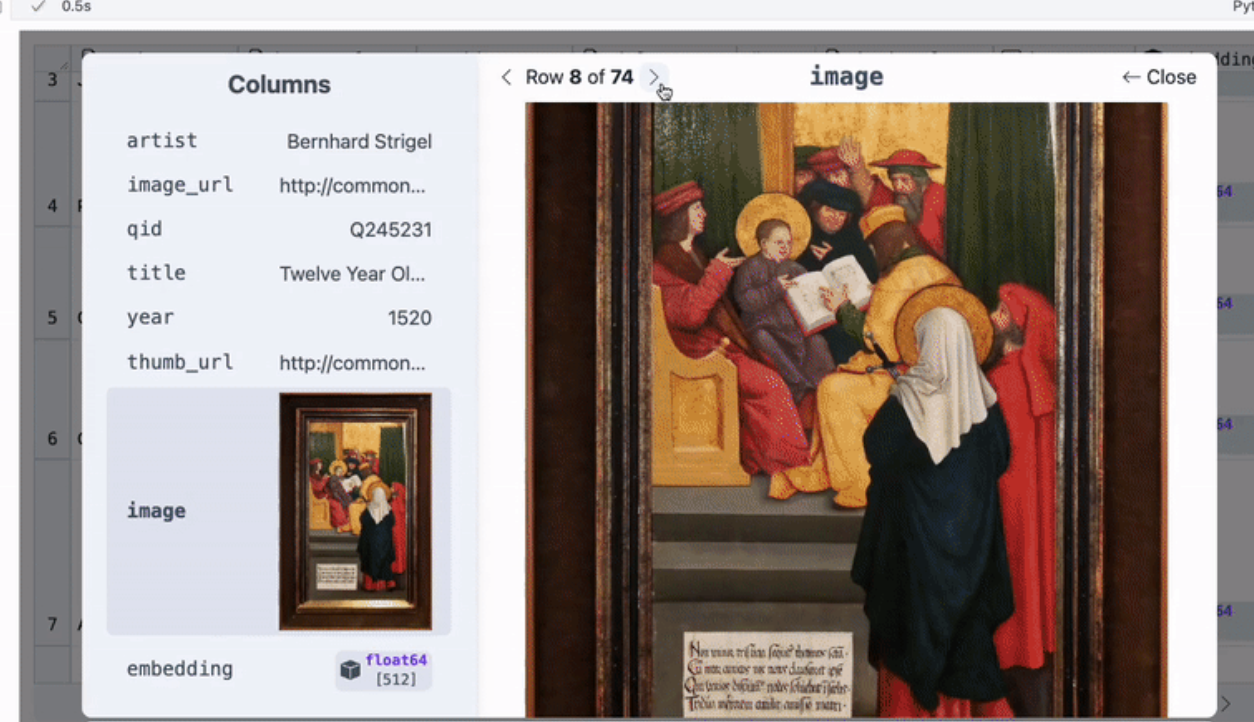
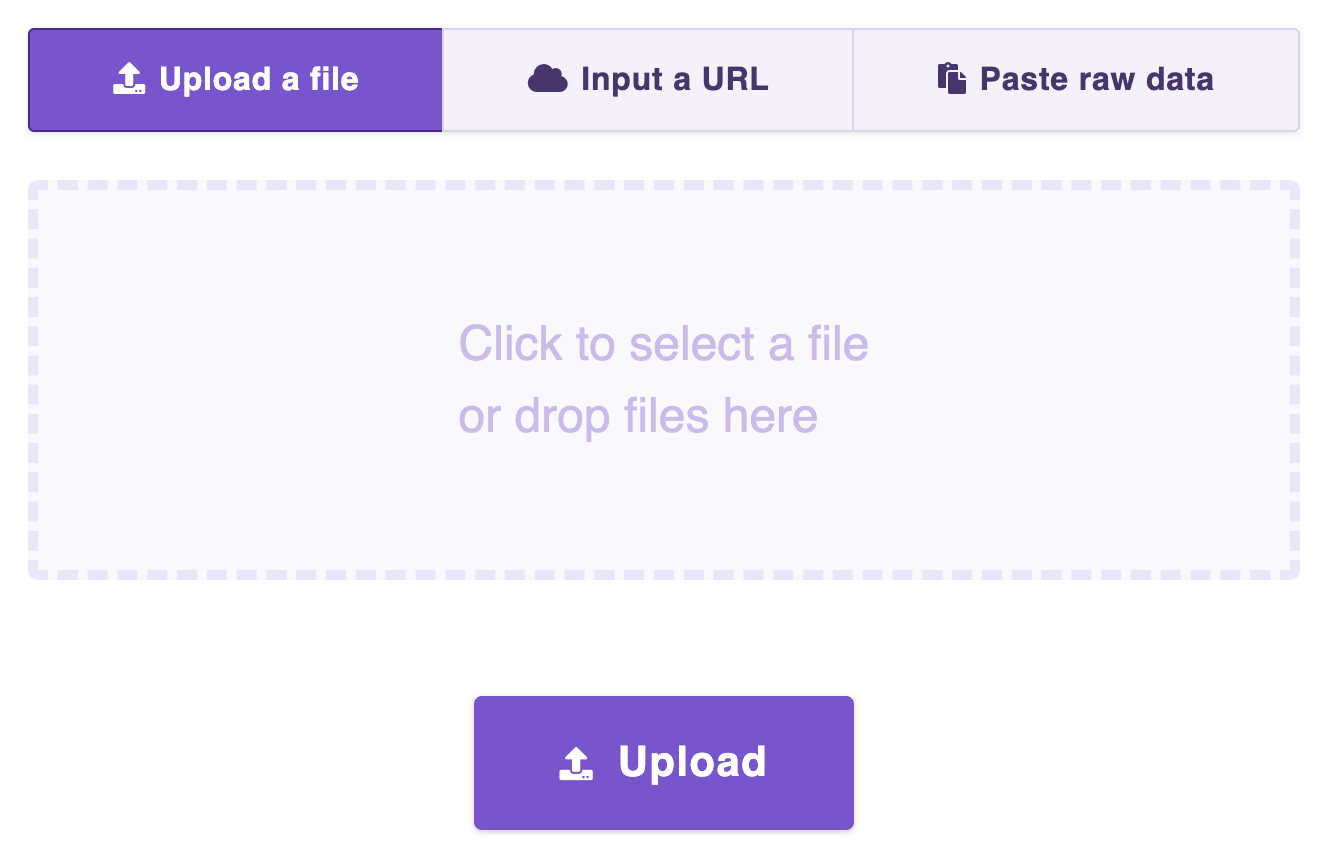
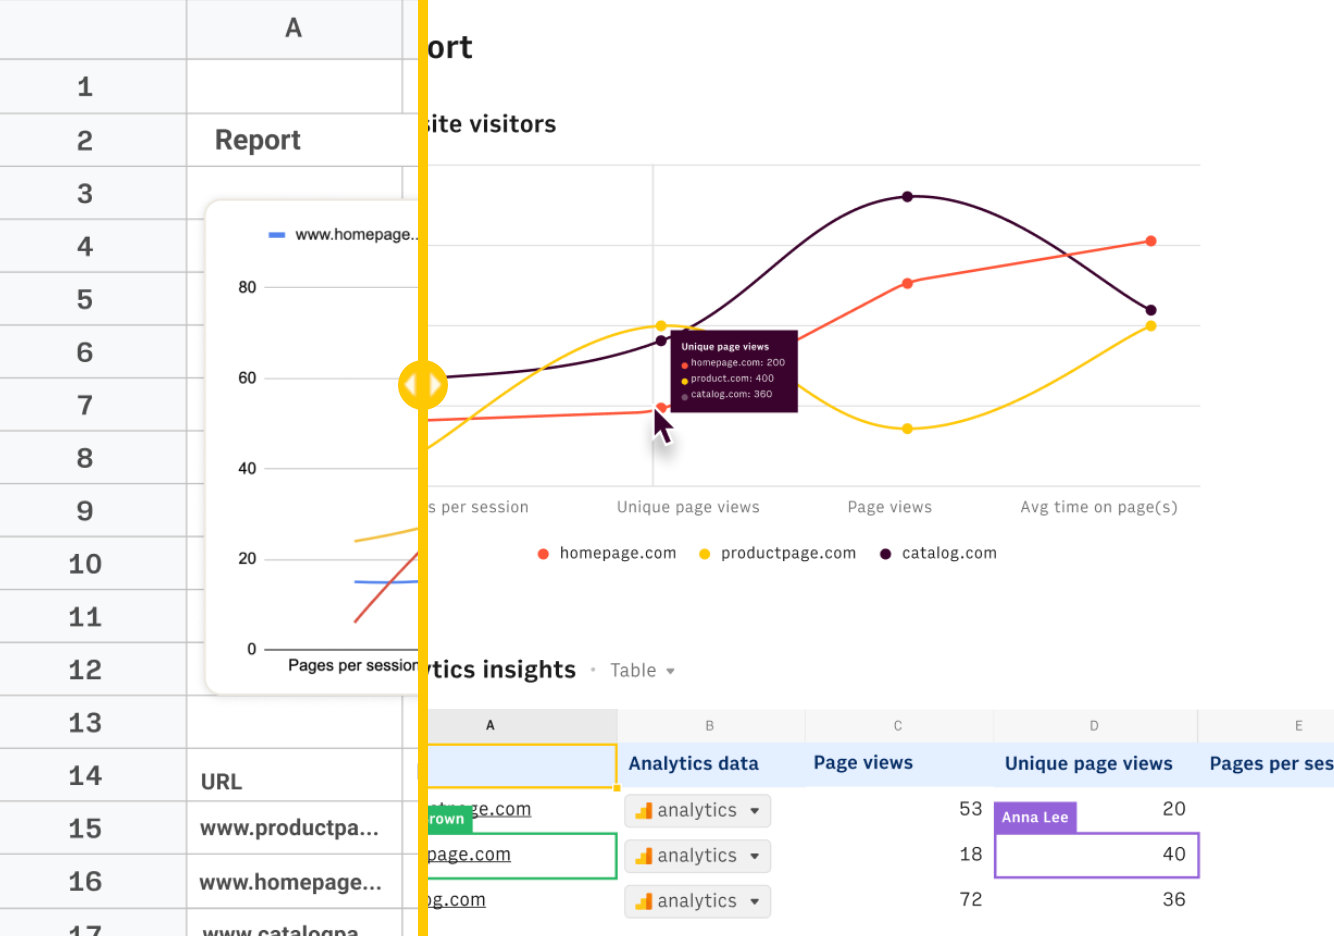
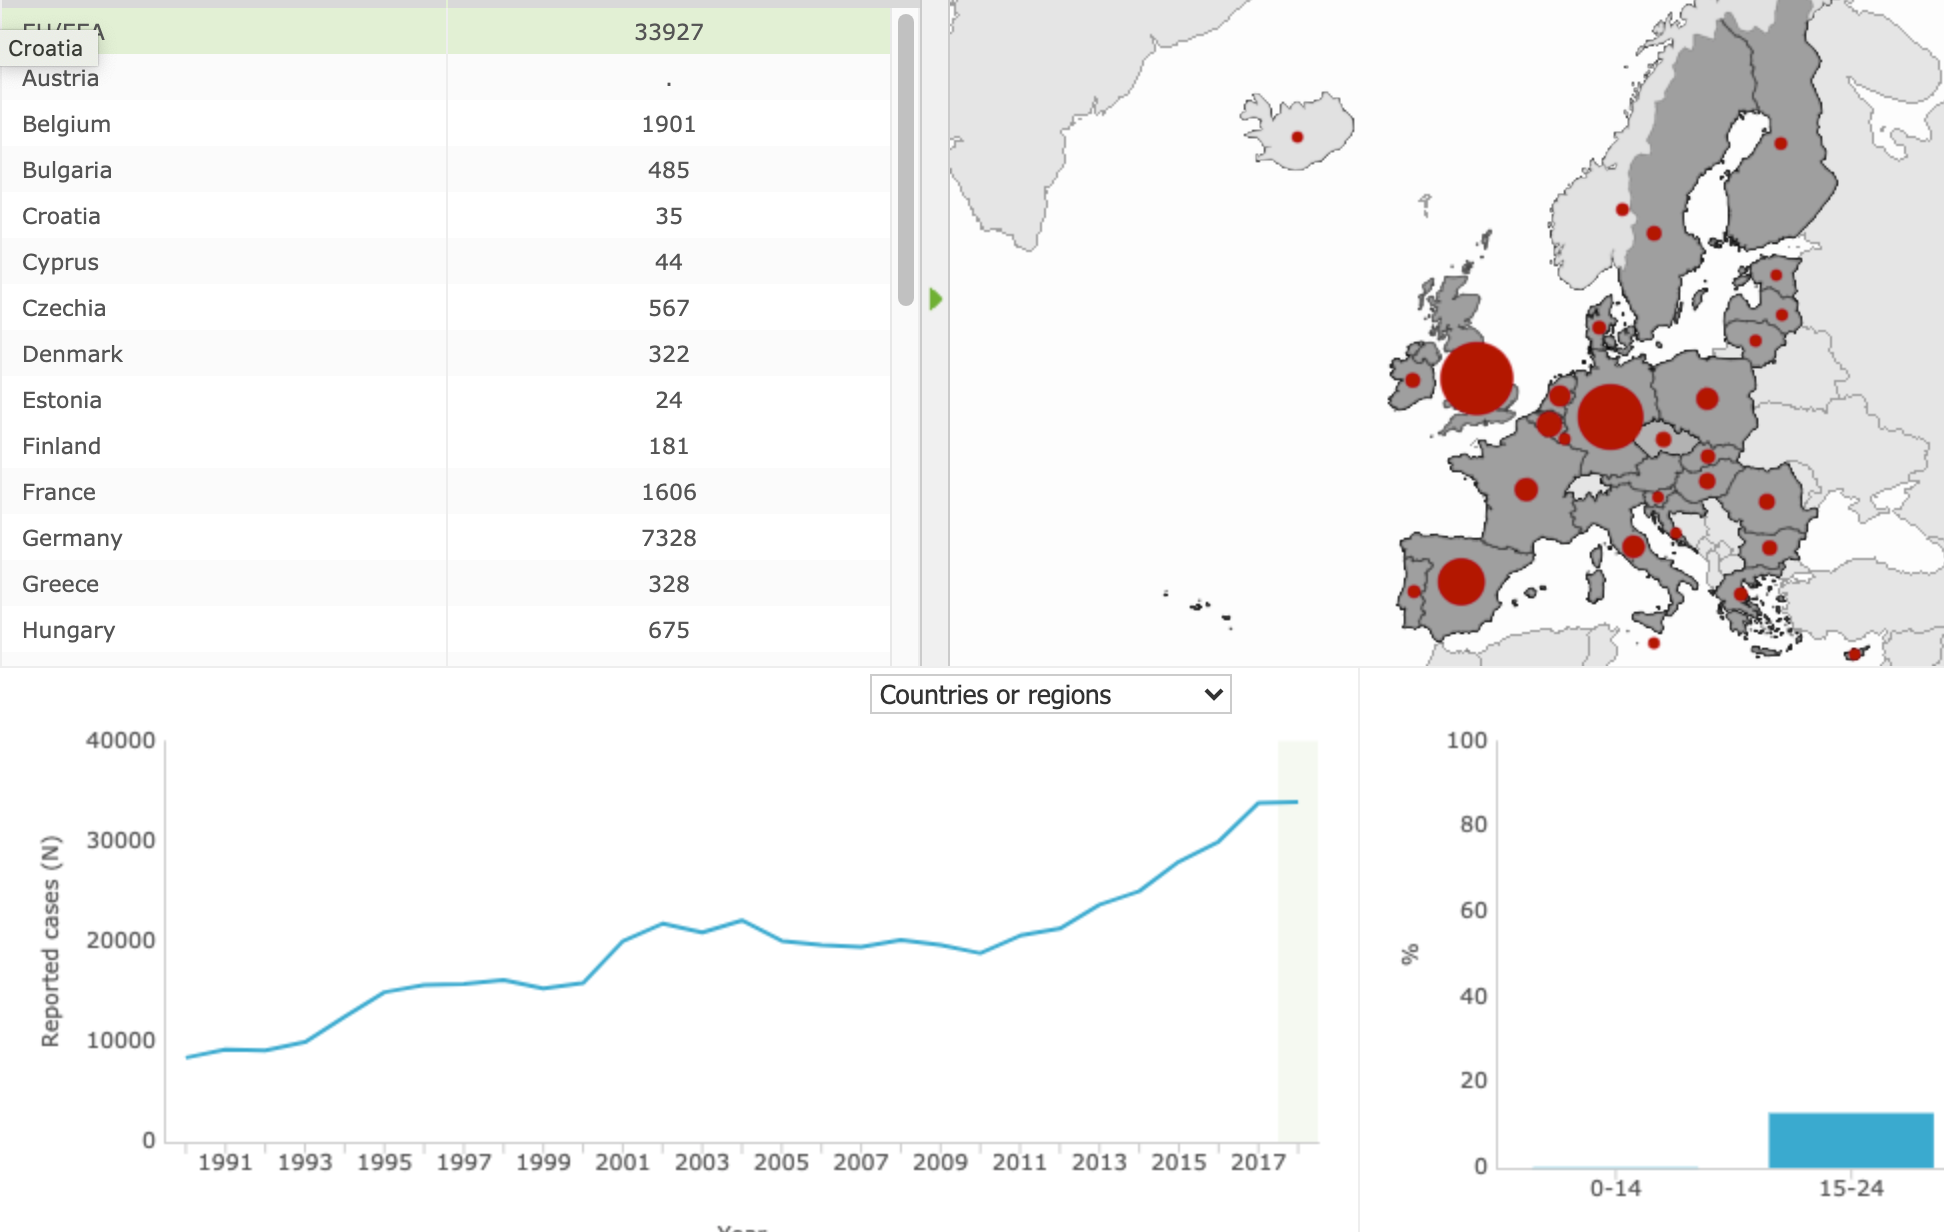
Rowboat CSV Explorer
Drop a CSV or Excel file on this app and your data becomes interestingly presented.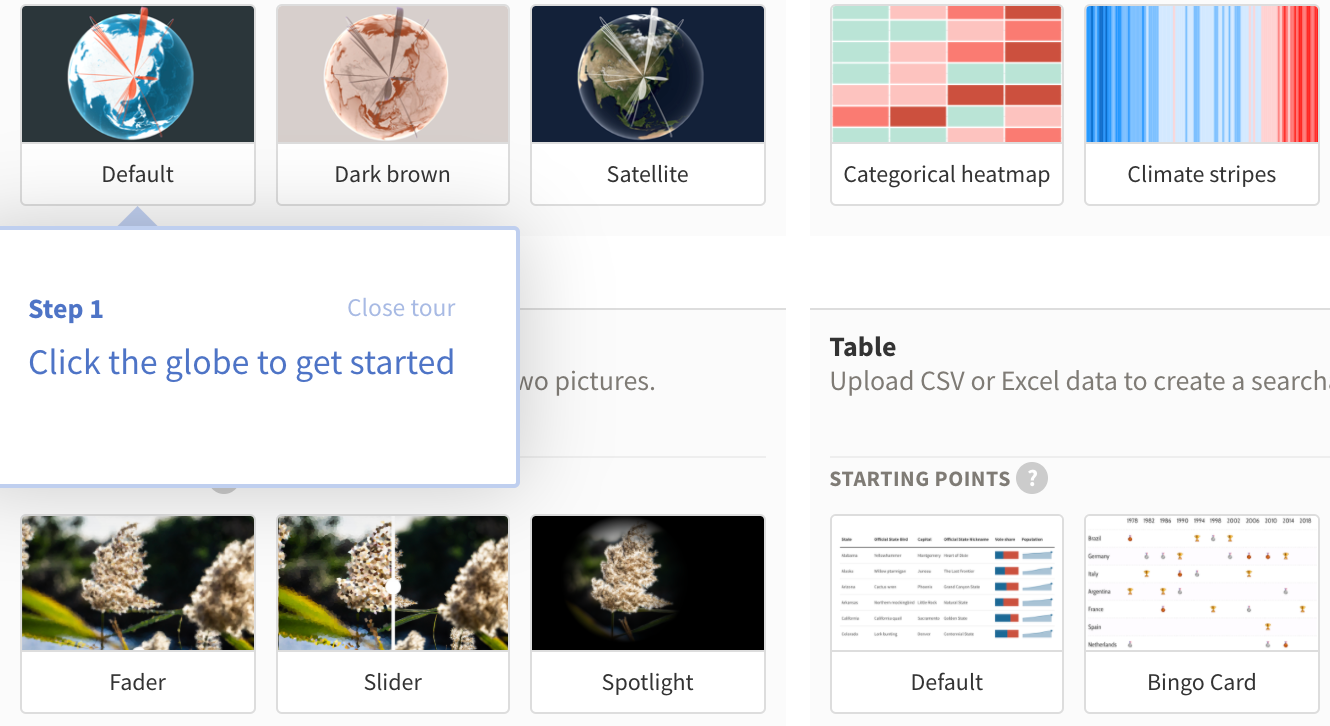
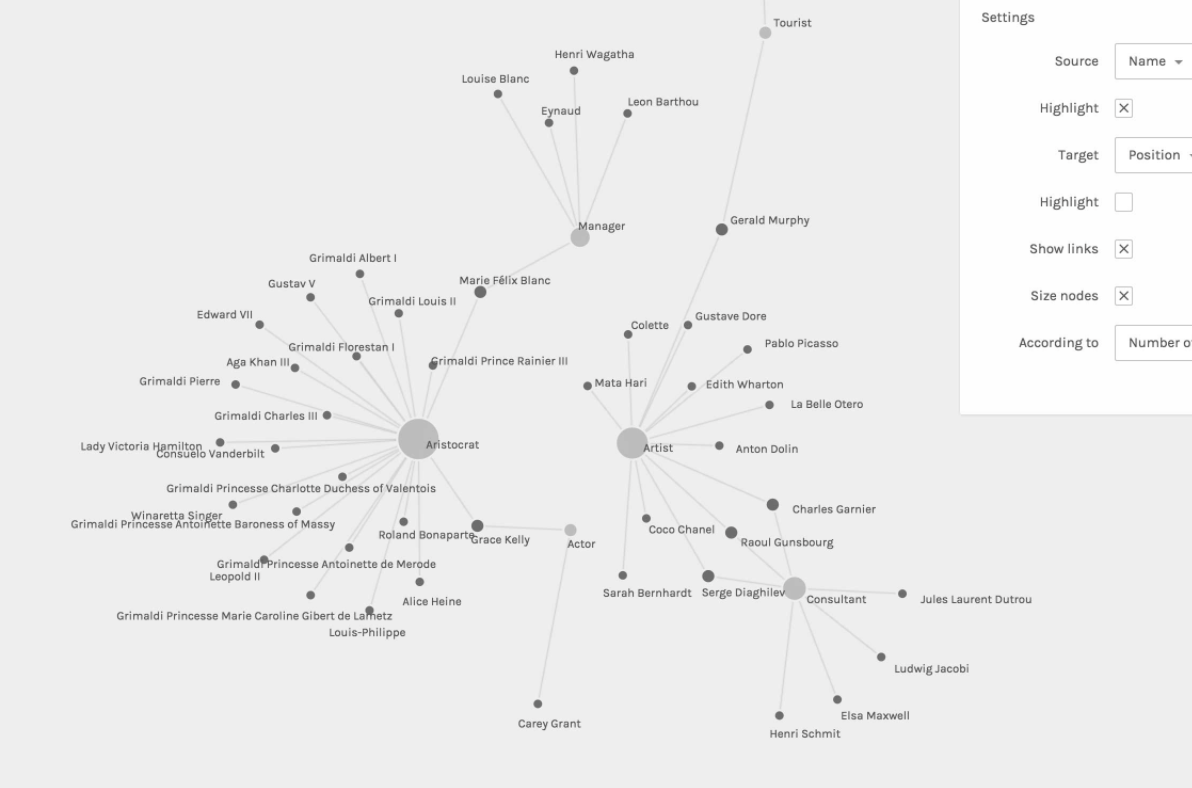
Little Sis
Brilliant site that is a mixture of a database of people and corporations and governments etc. and tools to "connect the dots" between them.
For example, take a look at How Fracking Special Interests Infiltrate the UK Parliament
See also: My Little Crony
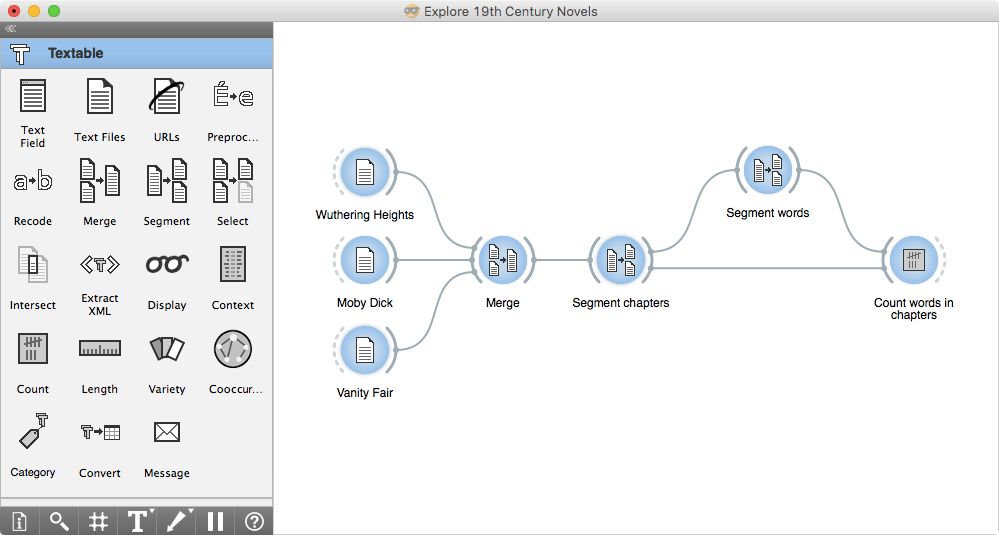
Textable
Textable is an Add-on to a really interesting visual tool call Orange3. With them together you can do textual or data analysis and shaping, and filtering, WITHOUT coding.
Taguette
If you need to tag, or codify some text, looking for themes in transcripts, this free web-based tool is great.

On Timeslines
How many ways are there to draw time? Think about what time aspects your data has, and go and see if you could could be displaying it better.
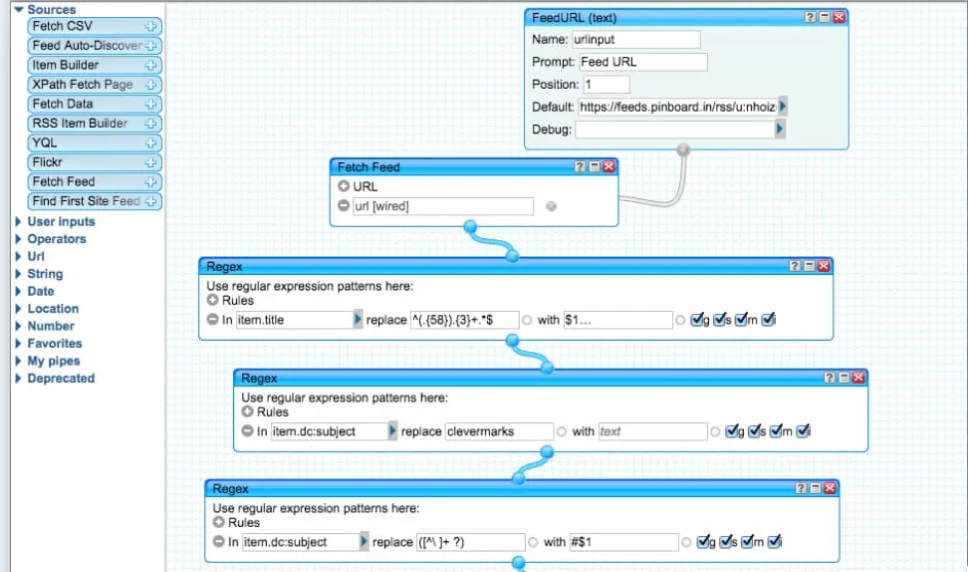
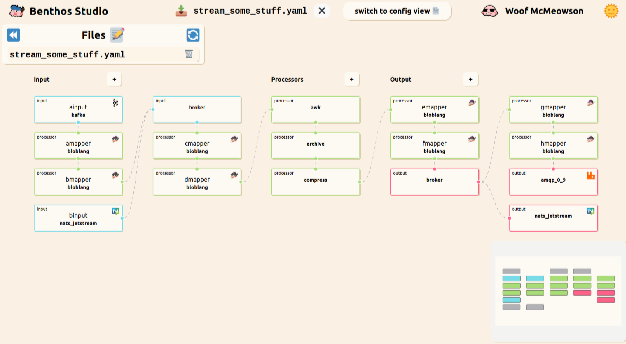
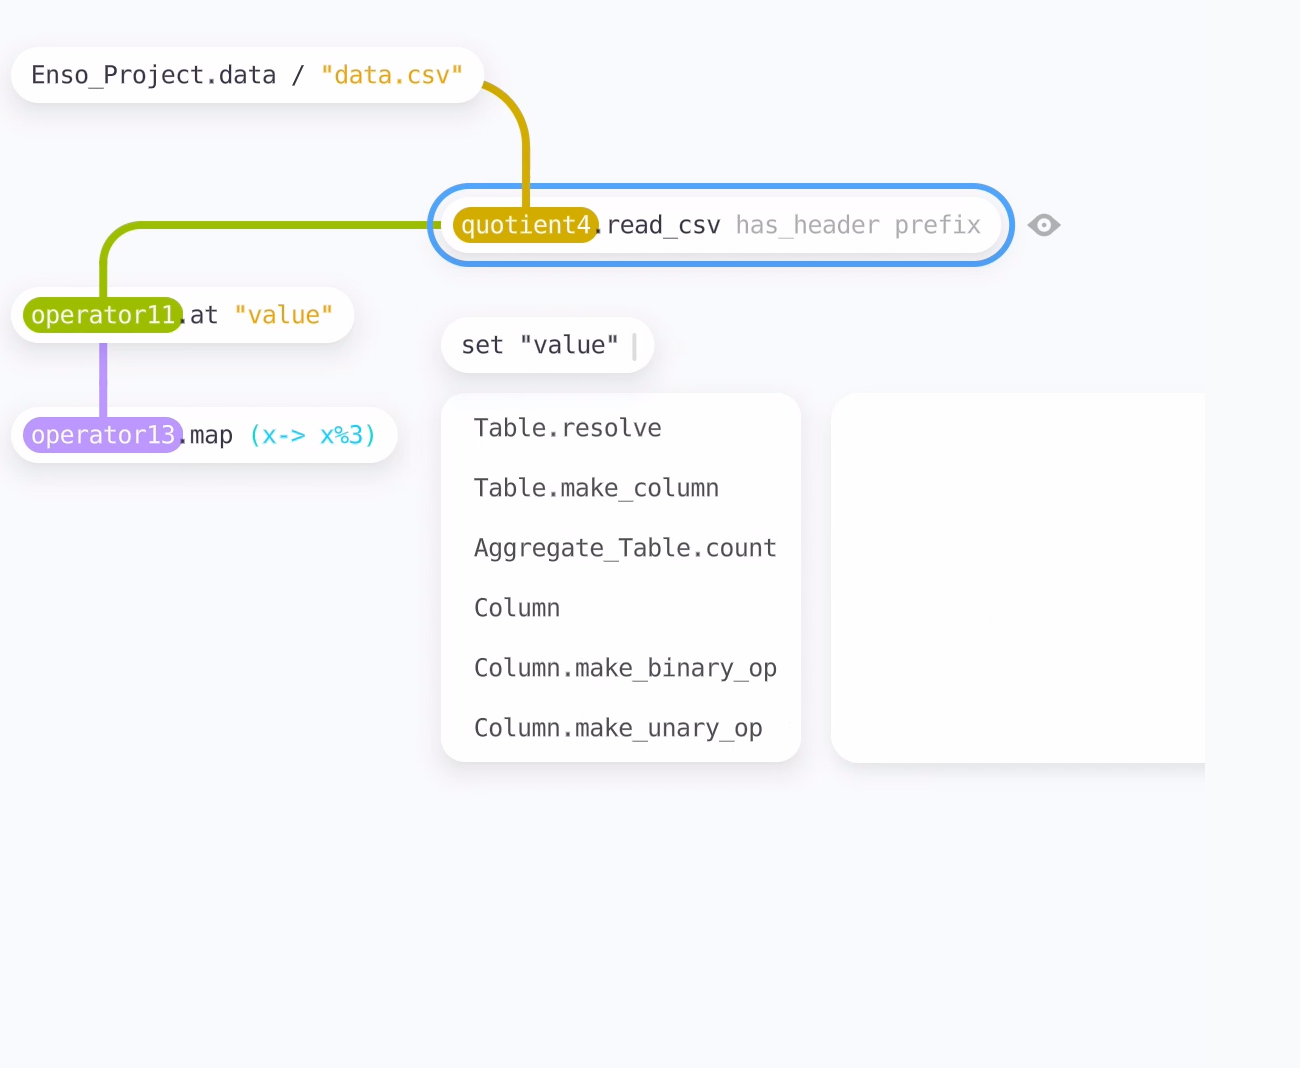
The Life And Times of Yahoo Pipes
Yahoo pipes, a visual data plumbing tool was one of the really cool tools/ideas of the dotcom era. You can see a little of it in Orange3 or Enso (check them out too).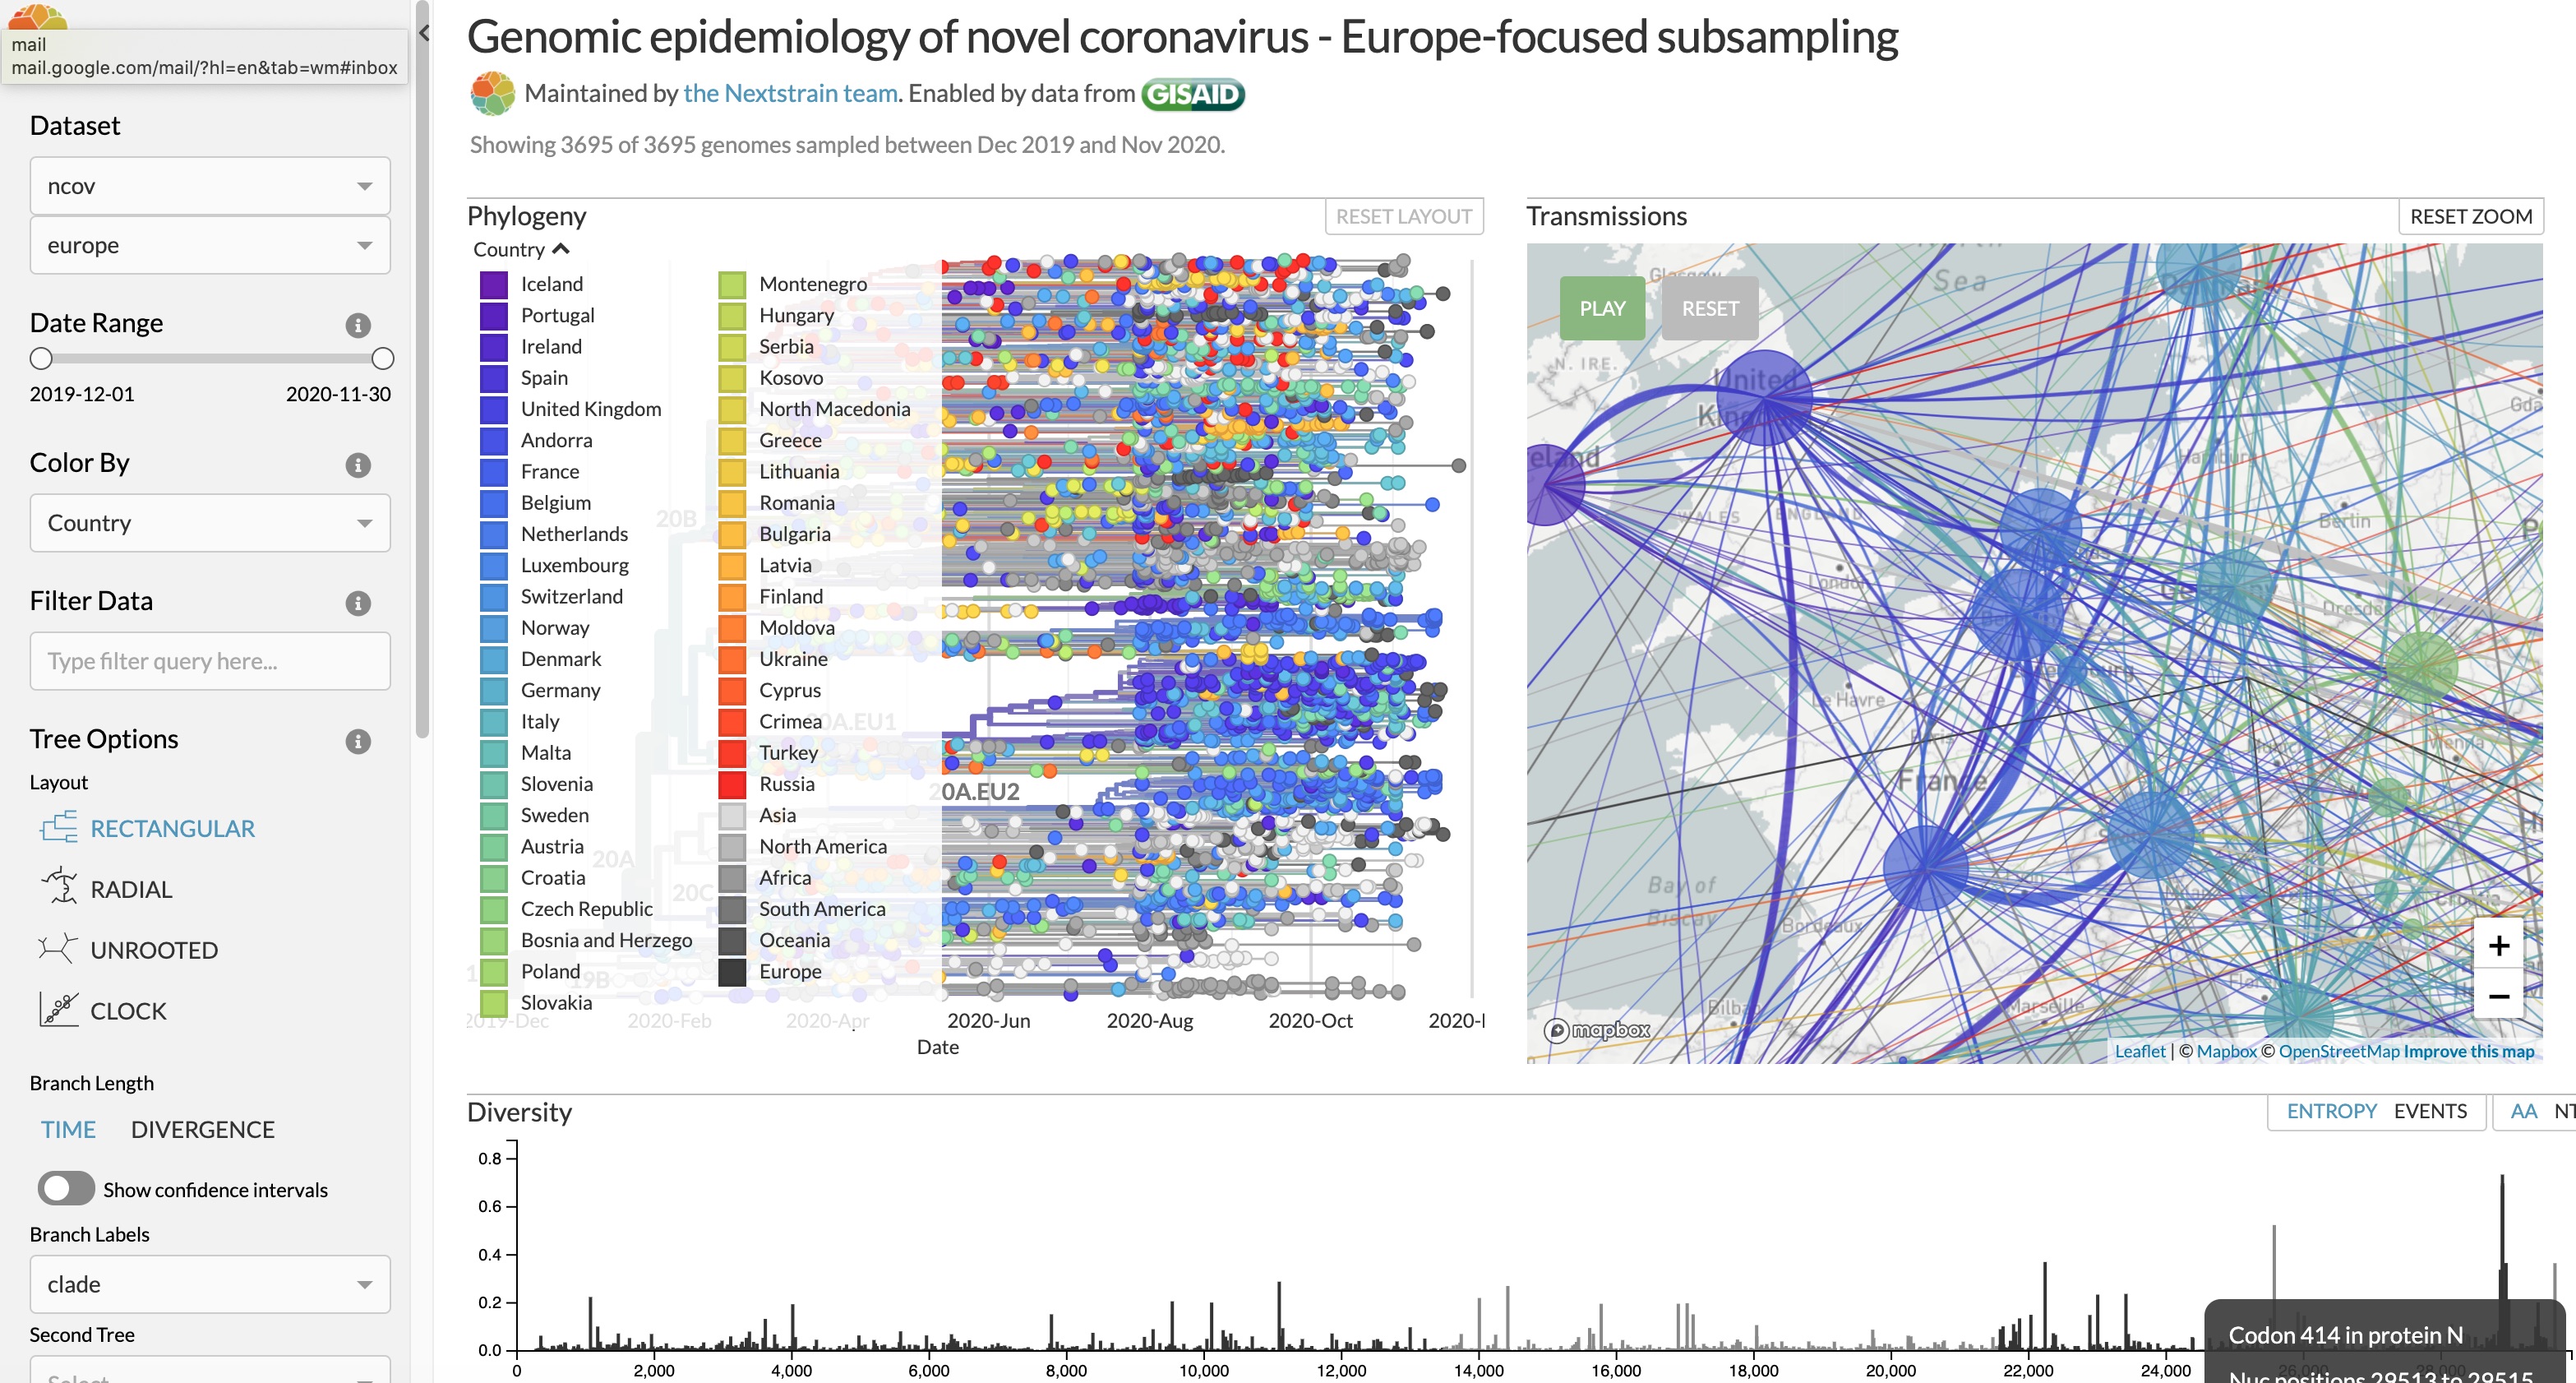
Sound of AURORA BOREALIS 2 | SOUND OF SPACE
Auroral radio emissions are associated with the Northern Lights or Aurora. The most intense of these emissions is a phenomenon called Auroral Kilometric Radiation (AKR). It is produced in the auroral zones at an altitude between 3000 and 20 000 kilometres.
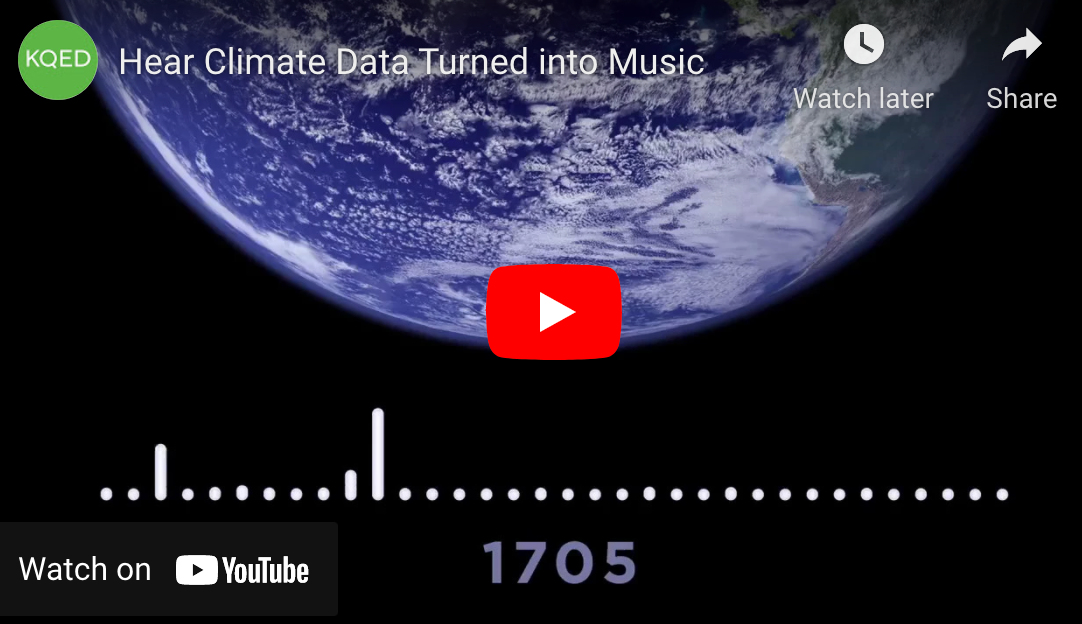
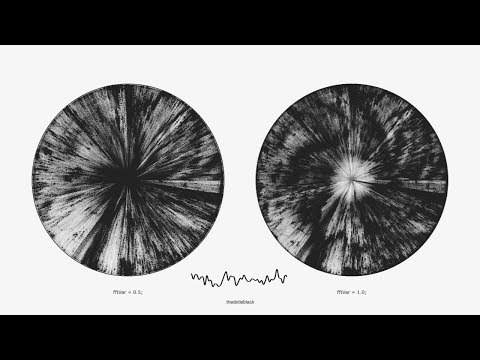
Making numbers louder
Excellent article that links to a number of projects working in the area of sonification, turning data into sounds.
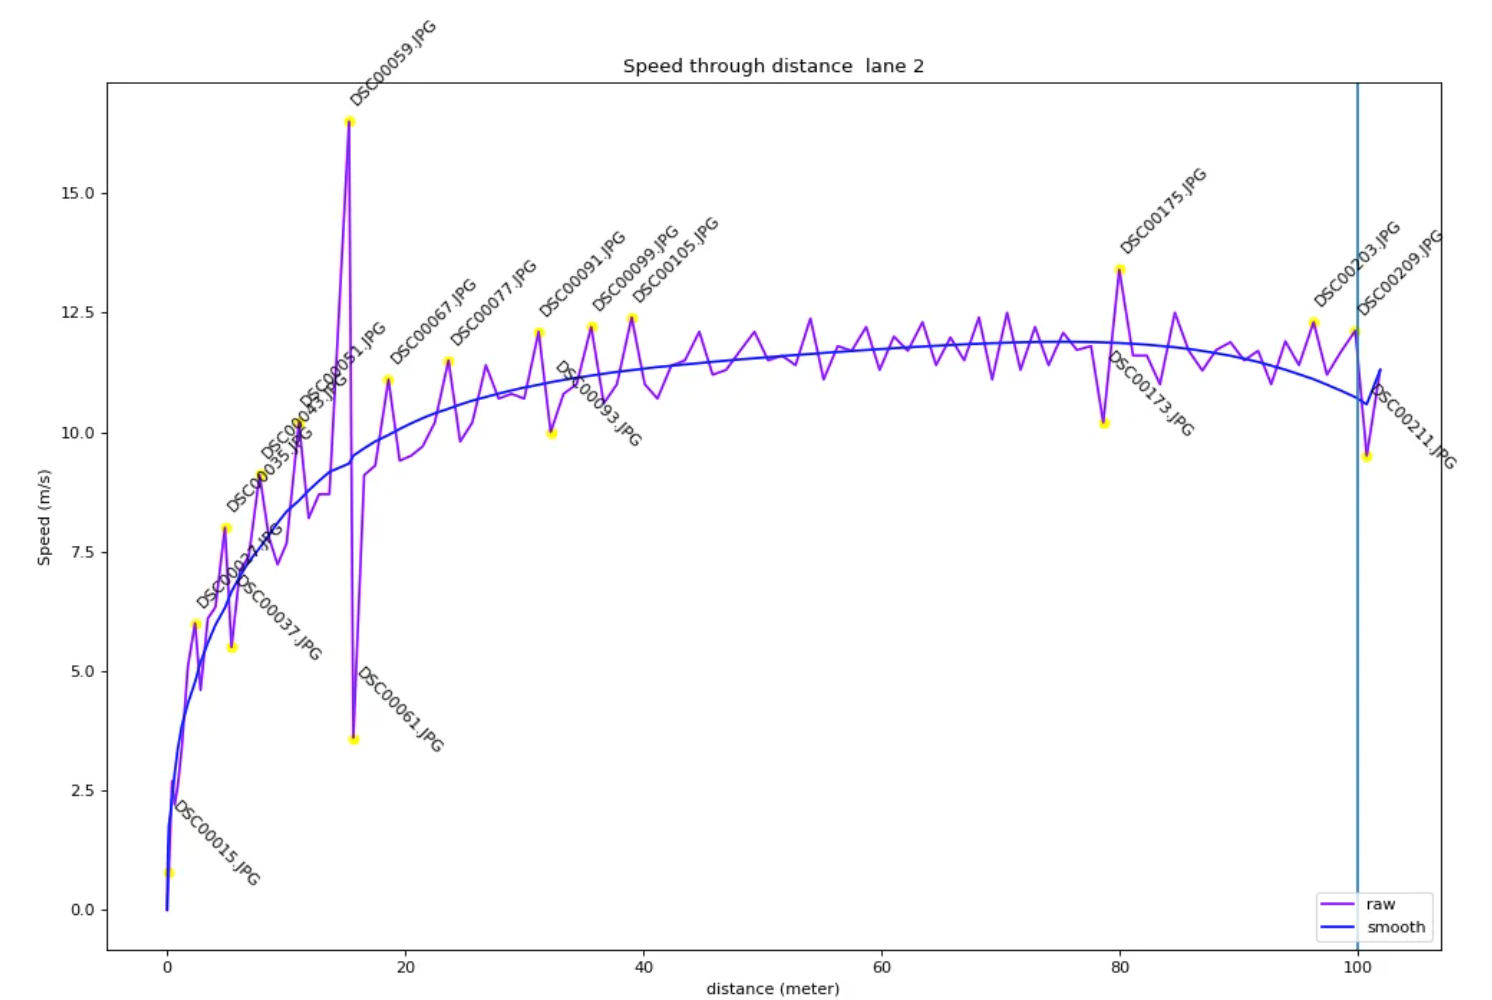
Discovering Speed Data From Photos
Interesting article on how photos are used to generate speed data from the Tokyo Olympics.
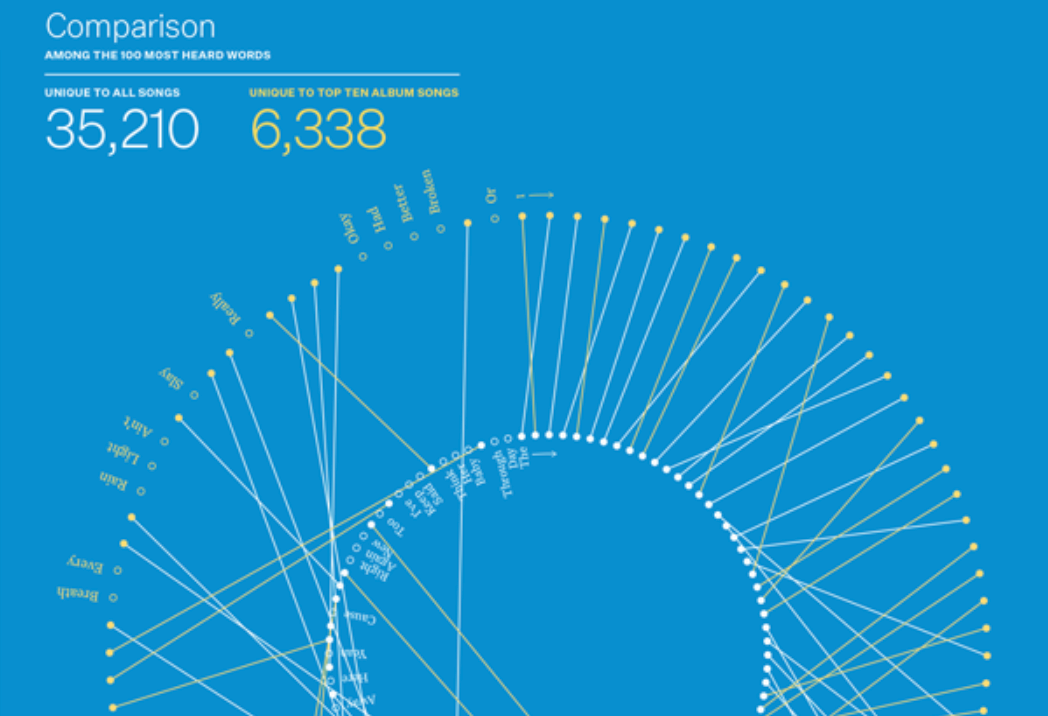
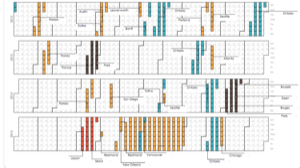
A Year In Lyrics
An interesting quantified self project in which Eric visualise the lyrics of all the songs he's listened to in numerous interesting ways
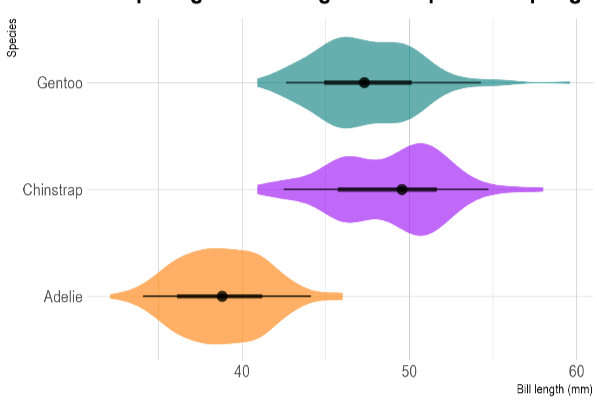
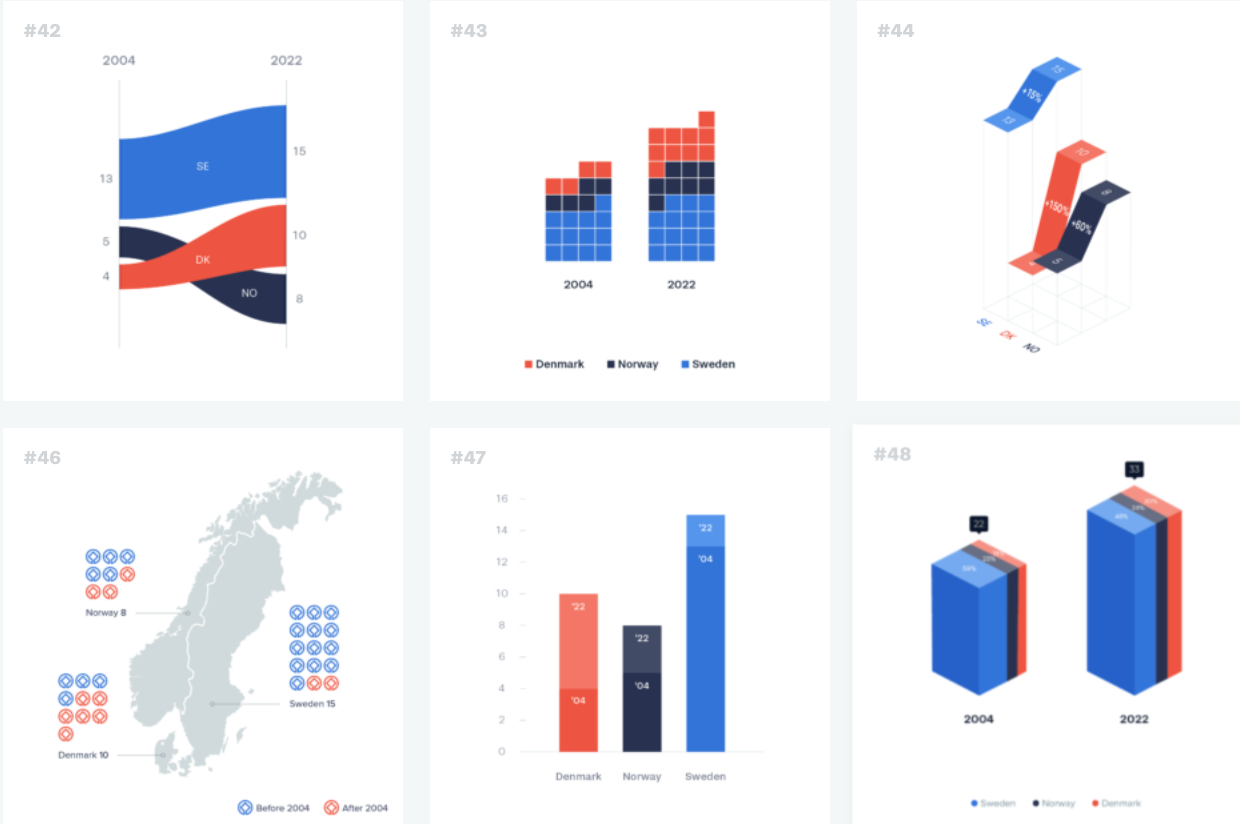
Data Visualisation Guide
Fabulous resources explaining a huge range of different visualisation types. Check out this excellent page on TIDY DATA..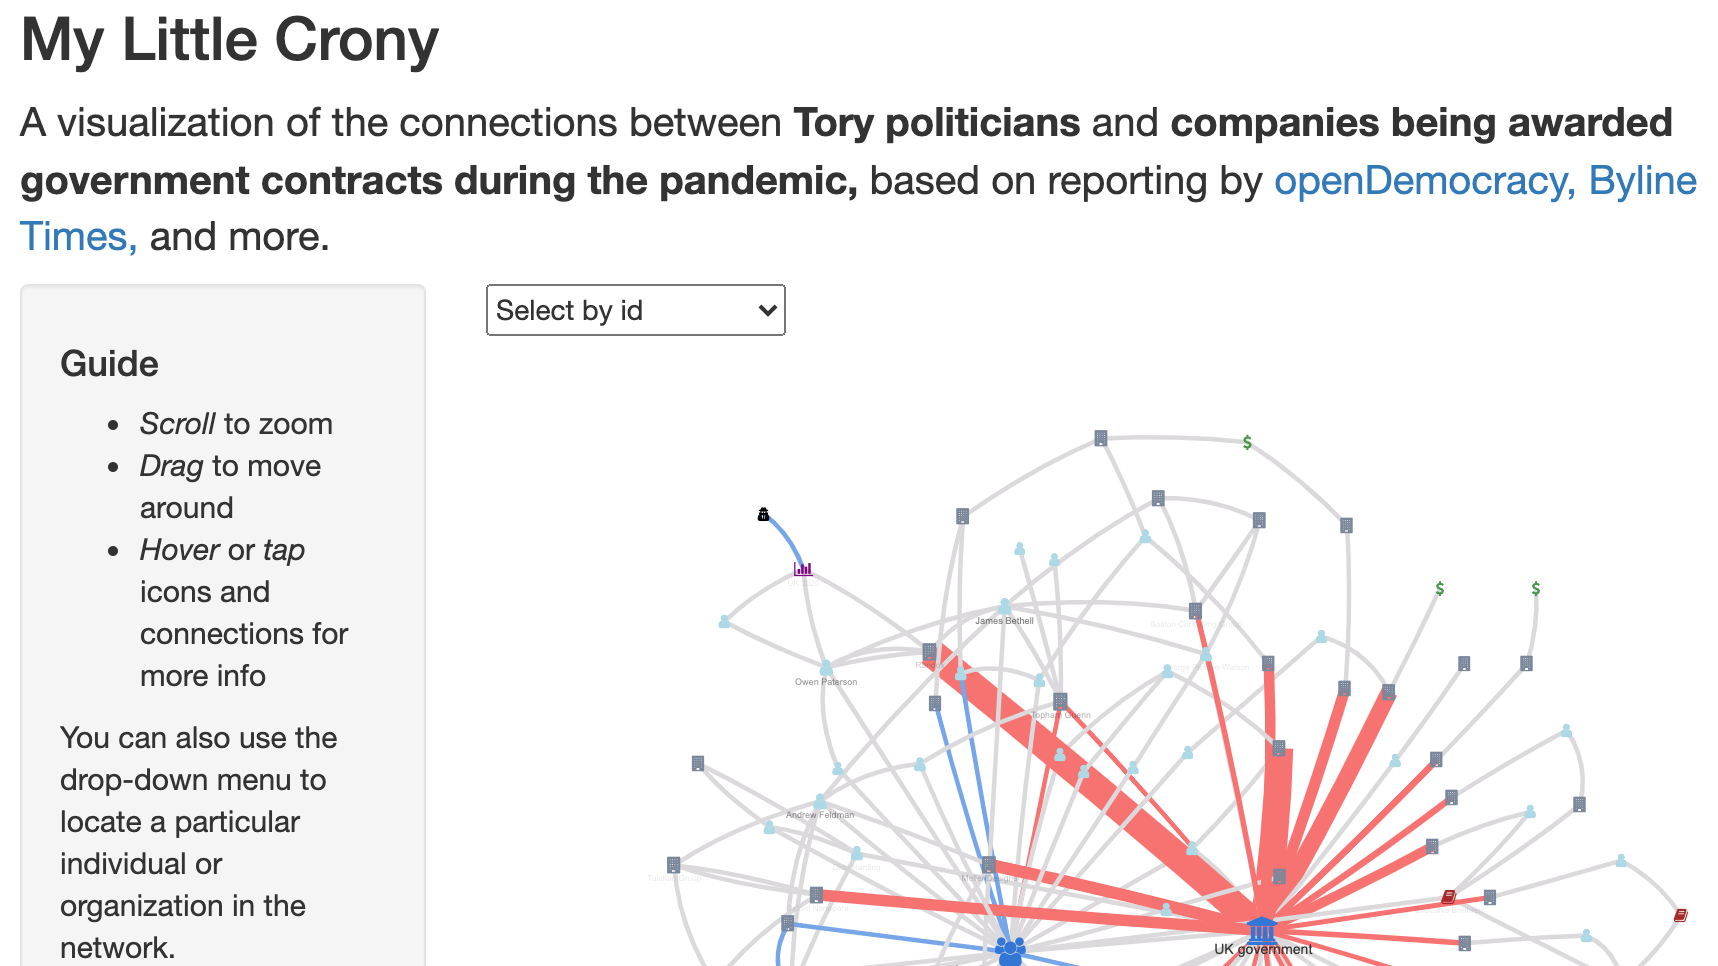
My Little Crony
Wonderful visualisation of connections, companies and corruption with UK politcians.

Dear Data
...whose creative practice ranges from book design, information design, data visualisation, and commissioned artworks using data.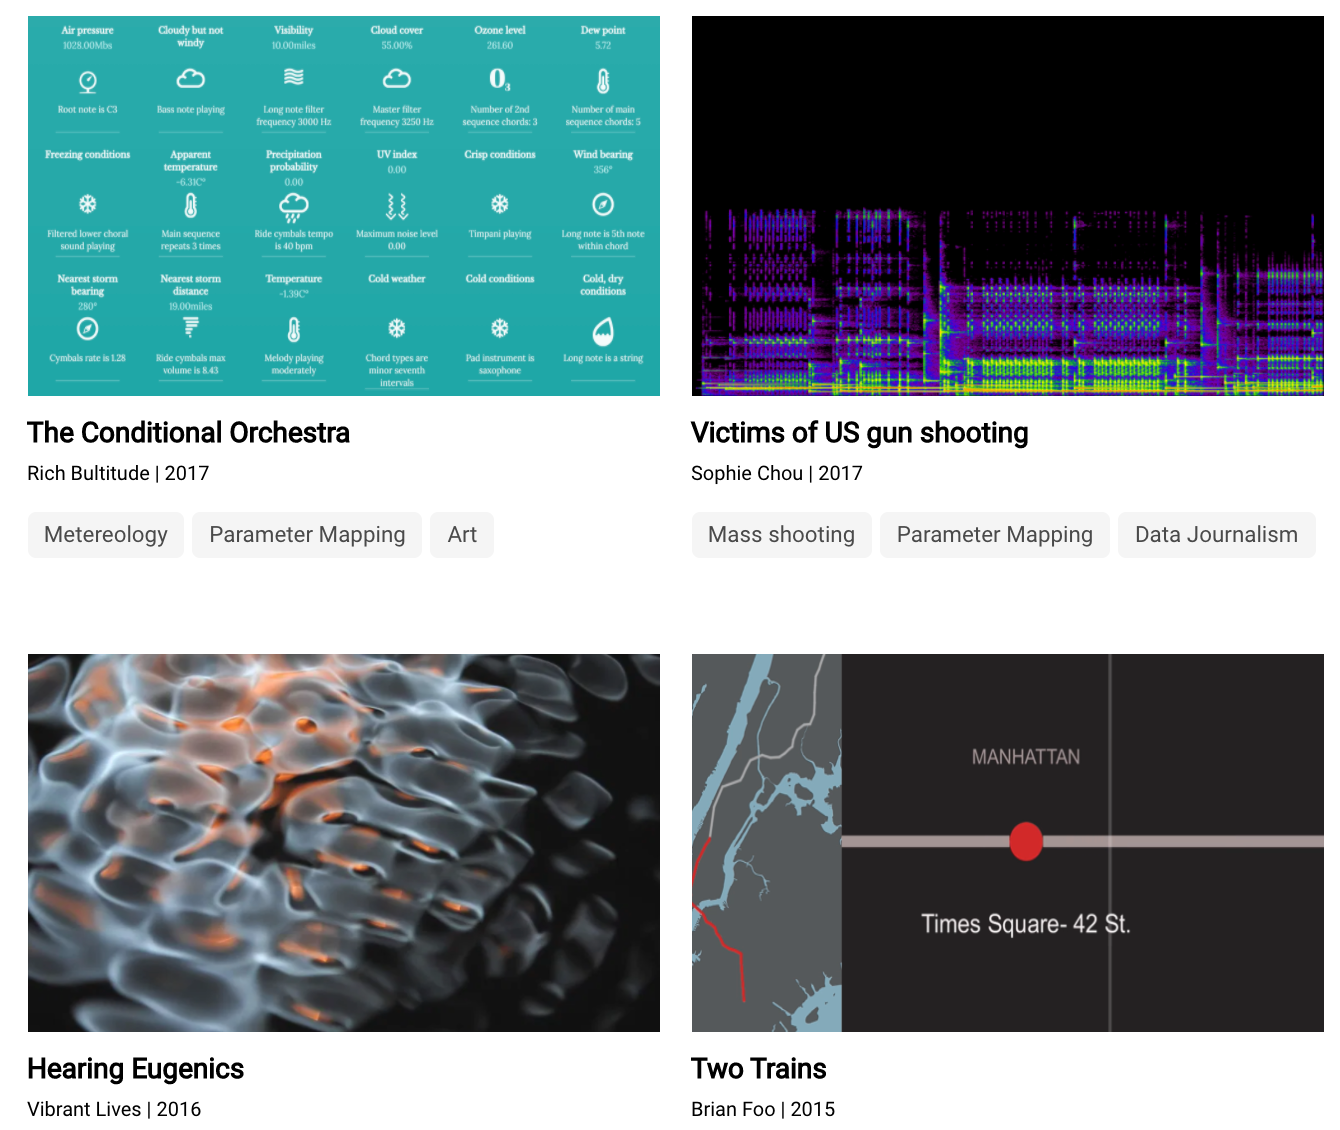
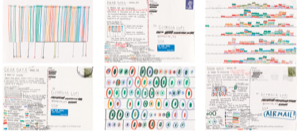
Data Sonification Archive
This curated collection is part of a broader research endeavour in which data, sonification and design converge to explore the potential of sound in complementing other modes of representation and broadening the publics of data.
Information Is Beatiful
A totally fantastic collection of visualisations and infographics to explore and imagine making yourself.
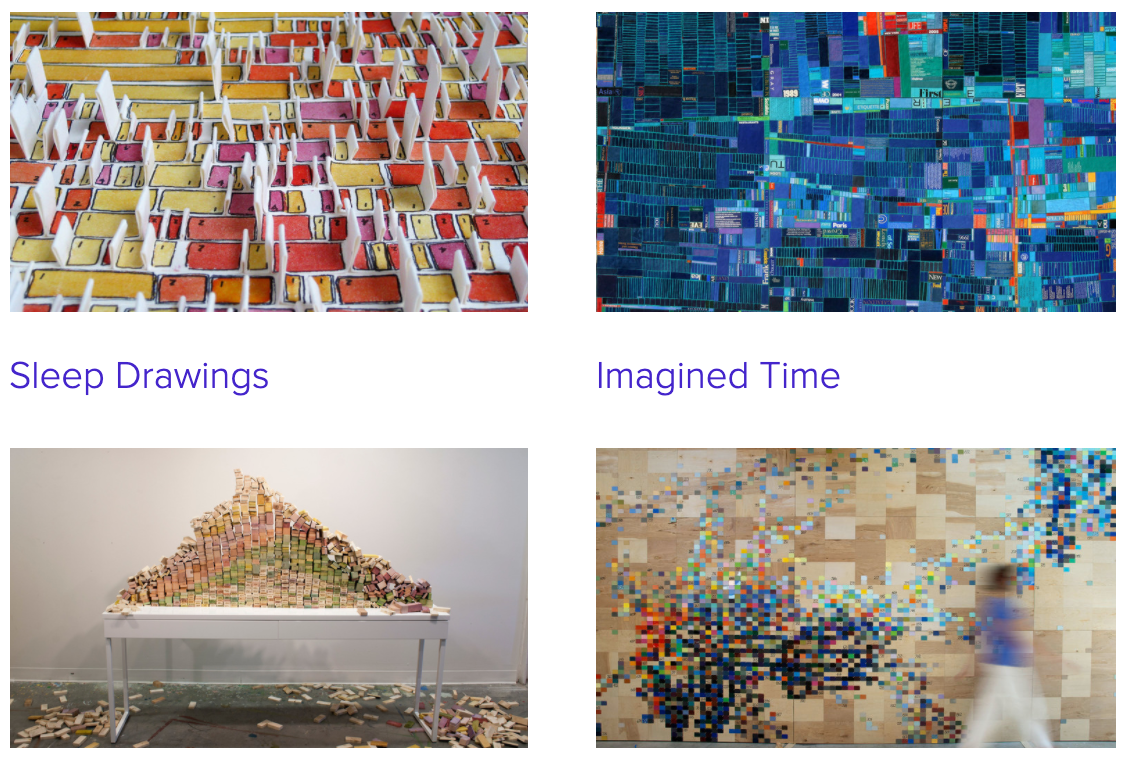
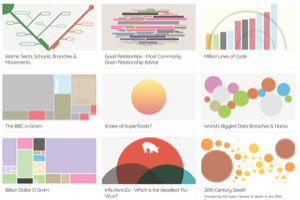
Laurie Frick's Quantified Art
Laurie uses data about herself to create fantastic artworks, or visualisations, or sculptures. Amazing.
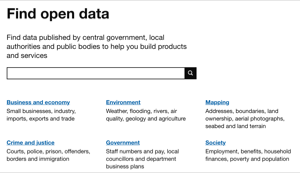
Data.gov.uk
Find data published by central government, local authorities and public bodies to help you build products and services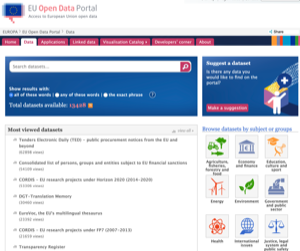
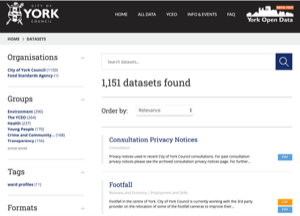
York Council Open Data
The City of York Council provides lots of data about all sorts of things in your area, such as spending or footfall numbers in the town in .csv format.
There are even .kml files of listed trees, or where litter bins are, that can be imported into Google My Maps or Google Earth.