 Turn Data Into Sound
Digital audio tracks are made of numbers. Lots of data.
What if your research data becomes music, what does it sound like and does it tell you anything that other visualisation techniques can't?
Can it even be done?
Inspiration
Go explore these resources and see what you think.
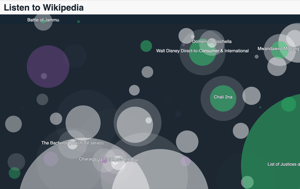
Listen To Wikipedia Updates
http://listen.hatnote.com/Visualisation of sorts that updates when Wikipedia edits are made

Sound of AURORA BOREALIS 2 | SOUND OF SPACE
https://www.youtube.com/watch?v=3mNWU1KoO6o&list=PLCRweOpyiotTcm4a1dKRYgg6KCo8Df-4b&index=35&t=0sAuroral radio emissions are associated with the Northern Lights or Aurora. The most intense of these emissions is a phenomenon called Auroral Kilometric Radiation (AKR). It is produced in the auroral zones at an altitude between 3000 and 20 000 kilometres.
Resources
Maybe there are some data sources freely available that you want to hear?
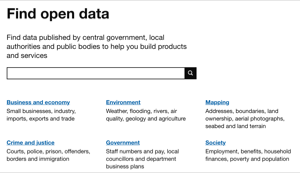
Data.gov.uk
https://data.gov.uk/Find data published by central government, local authorities and public bodies to help you build products and services
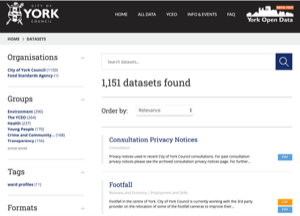
York Council Open Data
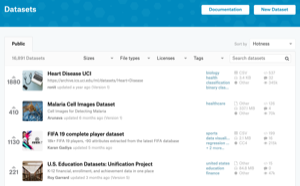
https://data.yorkopendata.org/datasetThe City of York Council provides lots of data about all sorts of things in your area, such as spending or footfall numbers in the town in .csv format.
There are even .kml files of listed trees, or where litter bins are, that can be imported into Google My Maps or Google Earth.
Tools
Often when you take raw data and listen to it, it creates a truly awful noise. Go try ImageToMusic or JPEGToWAV and see if you can choose an image that sounds, er, nice? You may have to edit the picture with Pixlr.
Clarallel is an interesting idea. It turns your name, or any word into a melody using musical cryptograms, like Bach, and others did.
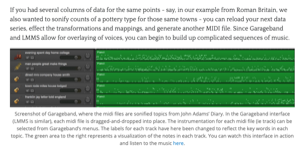
Tools like Musical Algorithms and TwoTone take your actual data and sonify it for you. If they "massage" your data so that it sounds nicer, is that cheating or is it allowed?
In-G
https://in-g.herokuapp.com/Interesting sonification example that takes Github upload data and turns it into "music". See this article. NO LONGER ONLINE
ImageToMusic
https://melobytes.com/app/image2musicTurn an image into an audio file. What does a picture sound like?
